The HyFiVeS Research Group
Hydroclimate, Fire, Vegetation, and Society
Welcome to the webpage for Park Williams and the HyFiVeS Research Group in the UCLA Department of Geography. We research the causes and consequences of changes in water availability across earth’s continents.
Recent highlights
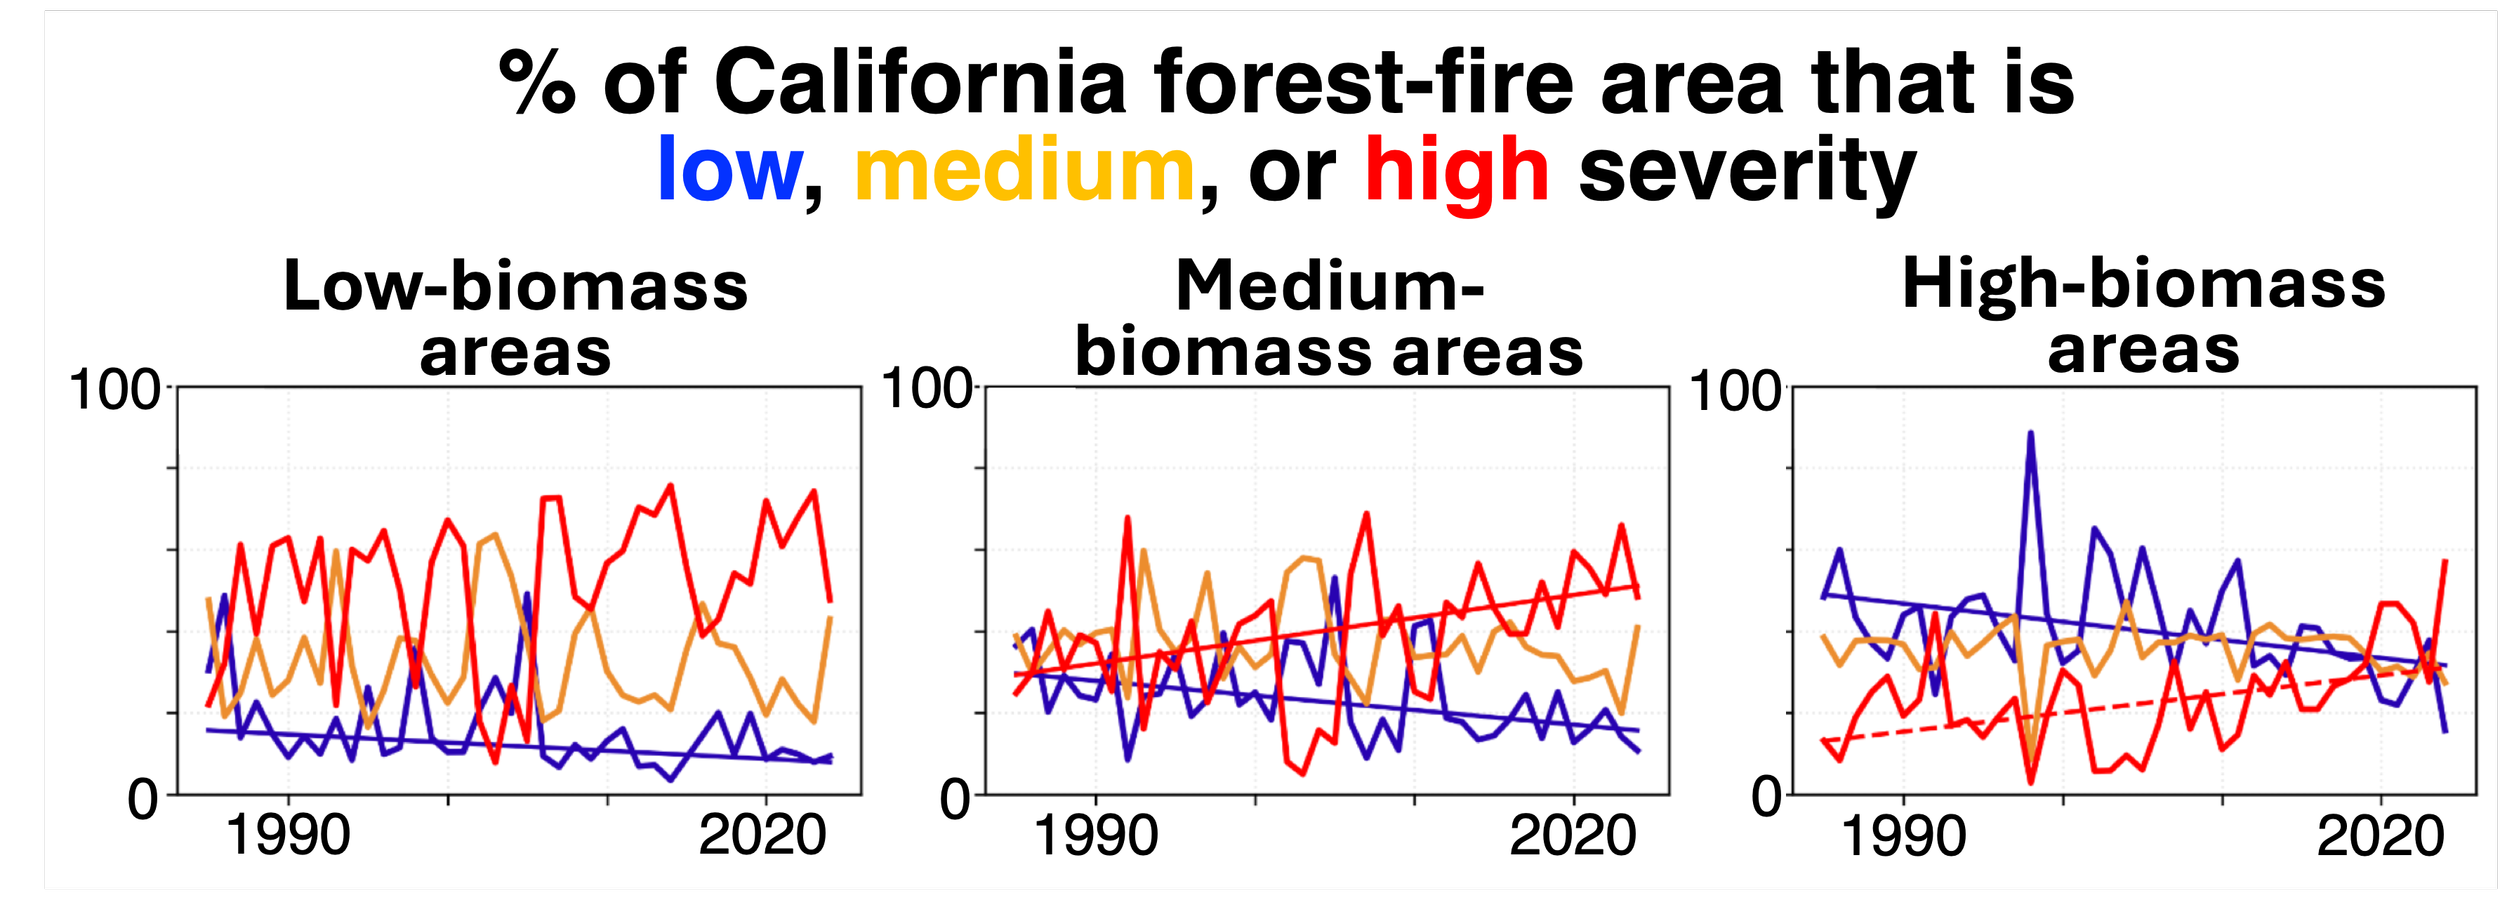
High-severity fire now dominant in California forests
Fire severity measures vegetation death caused by fire. In forests, high-severity forest fire kills essentially all trees and many western US forests are not well adapted for this. We used satellite imagery to make high-resolution maps of fire severity for >4,300 forest fires in California from 1985-2024. We found that as the annual forest area burned increased 10-fold during this time, which was already known, the area burned by high-severity fire increased more than 30-fold. High severity fire shifted from the least common fire-severity class in California’s forests to the most common. These trends were linked to drying and warming. The ability of drying and warming to drive increases in fire severity were strongest in more densely forested areas.
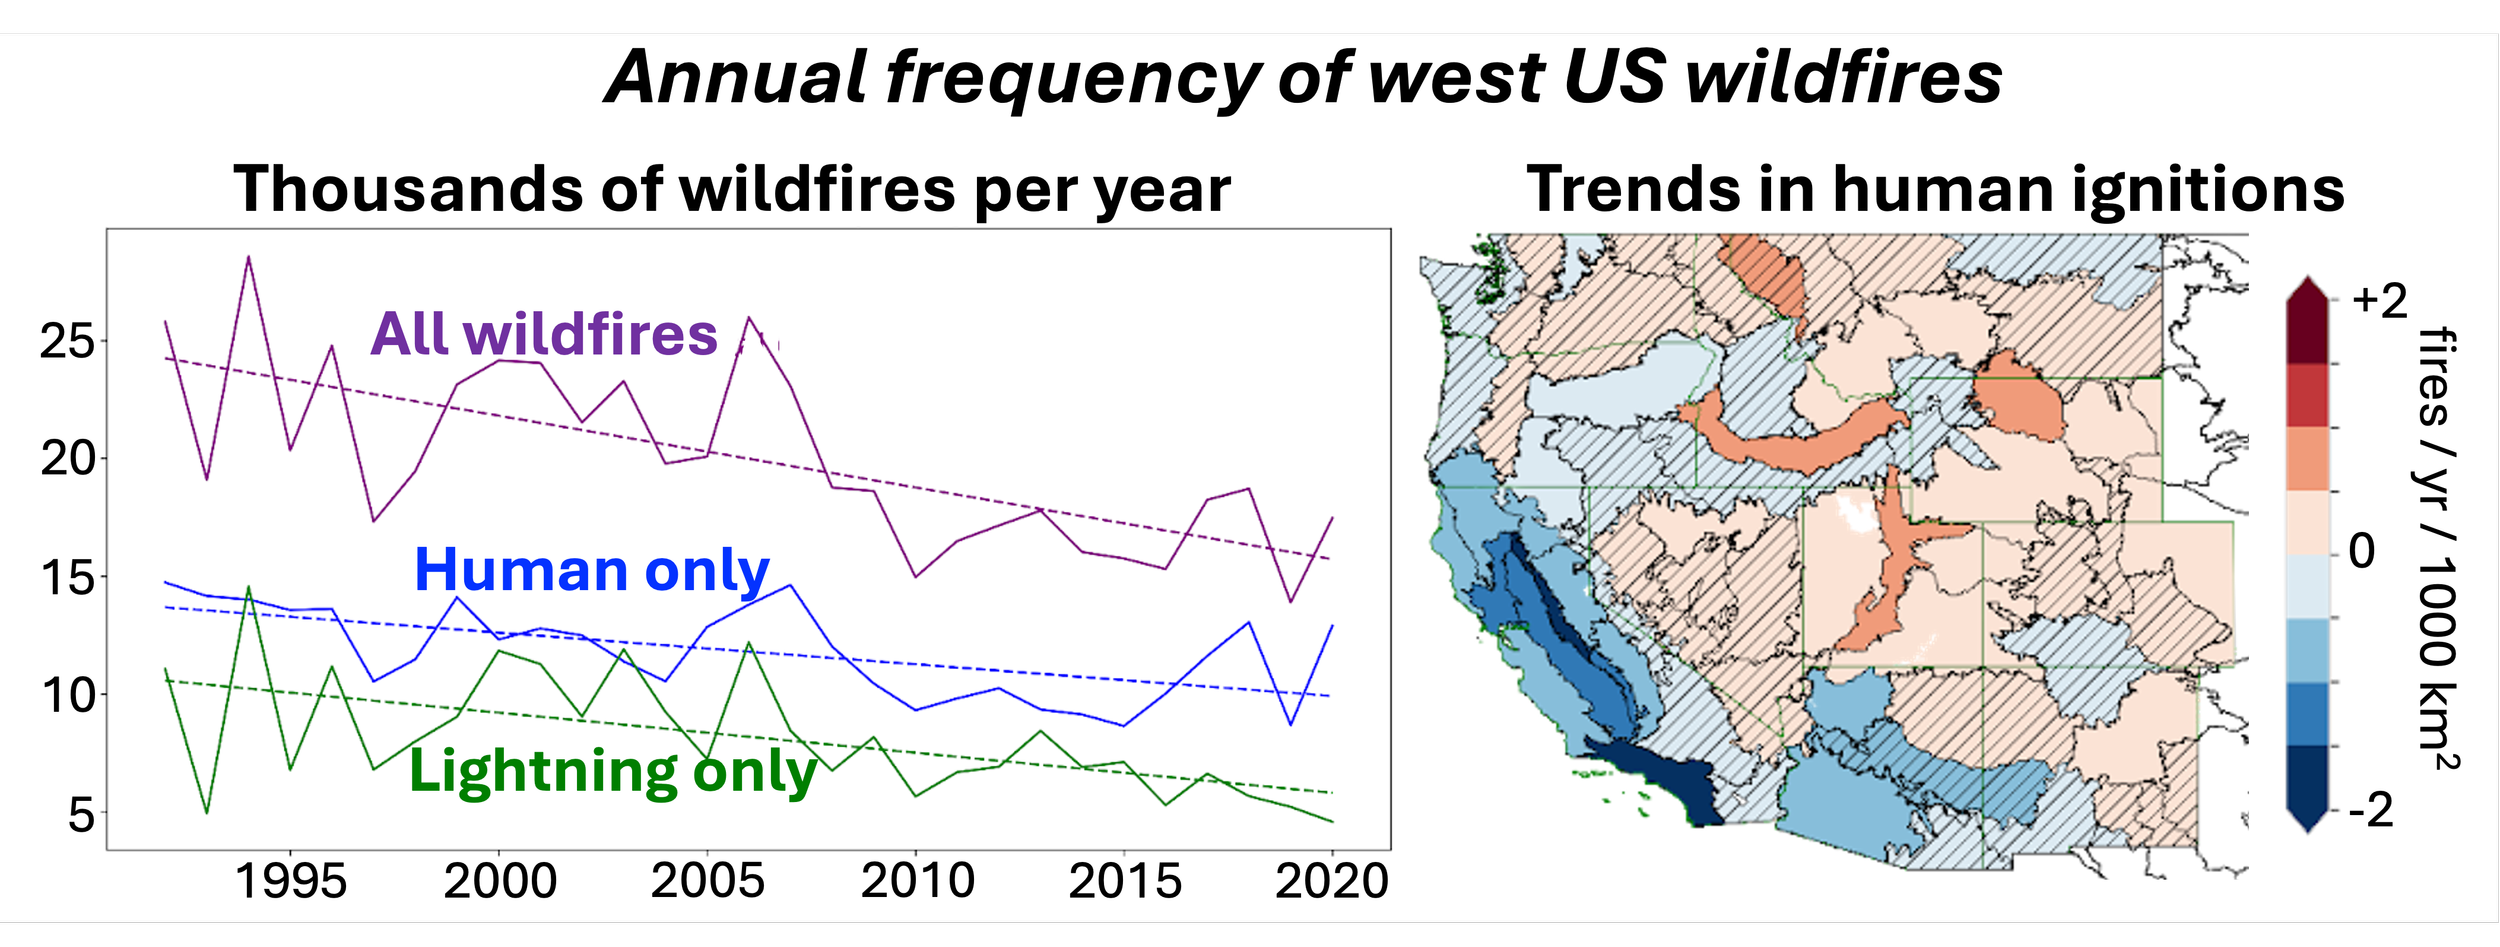
Trends in western United States wildfire frequency, 1992–2020.
Western US Fire Frequency and Links to Human Influence
Despite increases in the total area burned by wildfires, the number of western US wildfires per year has declined. Human caused fires have declined rapidly where population is high, and increased where it is low. As population grows in sparsely populated areas, potential for wildfire ignition grows, but only to a point, and after that point, wildfires decline, likely due to modified behavior and landscapes as well as greater suppression resources. Rapidly growing wildfire sizes despite lower fire numbers suggest continued improvements to fire prevention and suppression are unlikely to curb the ongoing increases in area burned and associated impacts.
New western US forest-fire model
The new Western US Large Forest-Fire Stochastic Simulator (WULFFSS) simulates the monthly probabilities and sizes of forest fires on a 12-km resolution grid as a function of topographic, vegetation, climate, and human variables. The model does well at reproducing observed spatiotemporal variations in forest fire over the past 40 years and can be used to explore the causes of past changes in forest-fire activity as well as the effects of future changes to climate and human behavior.
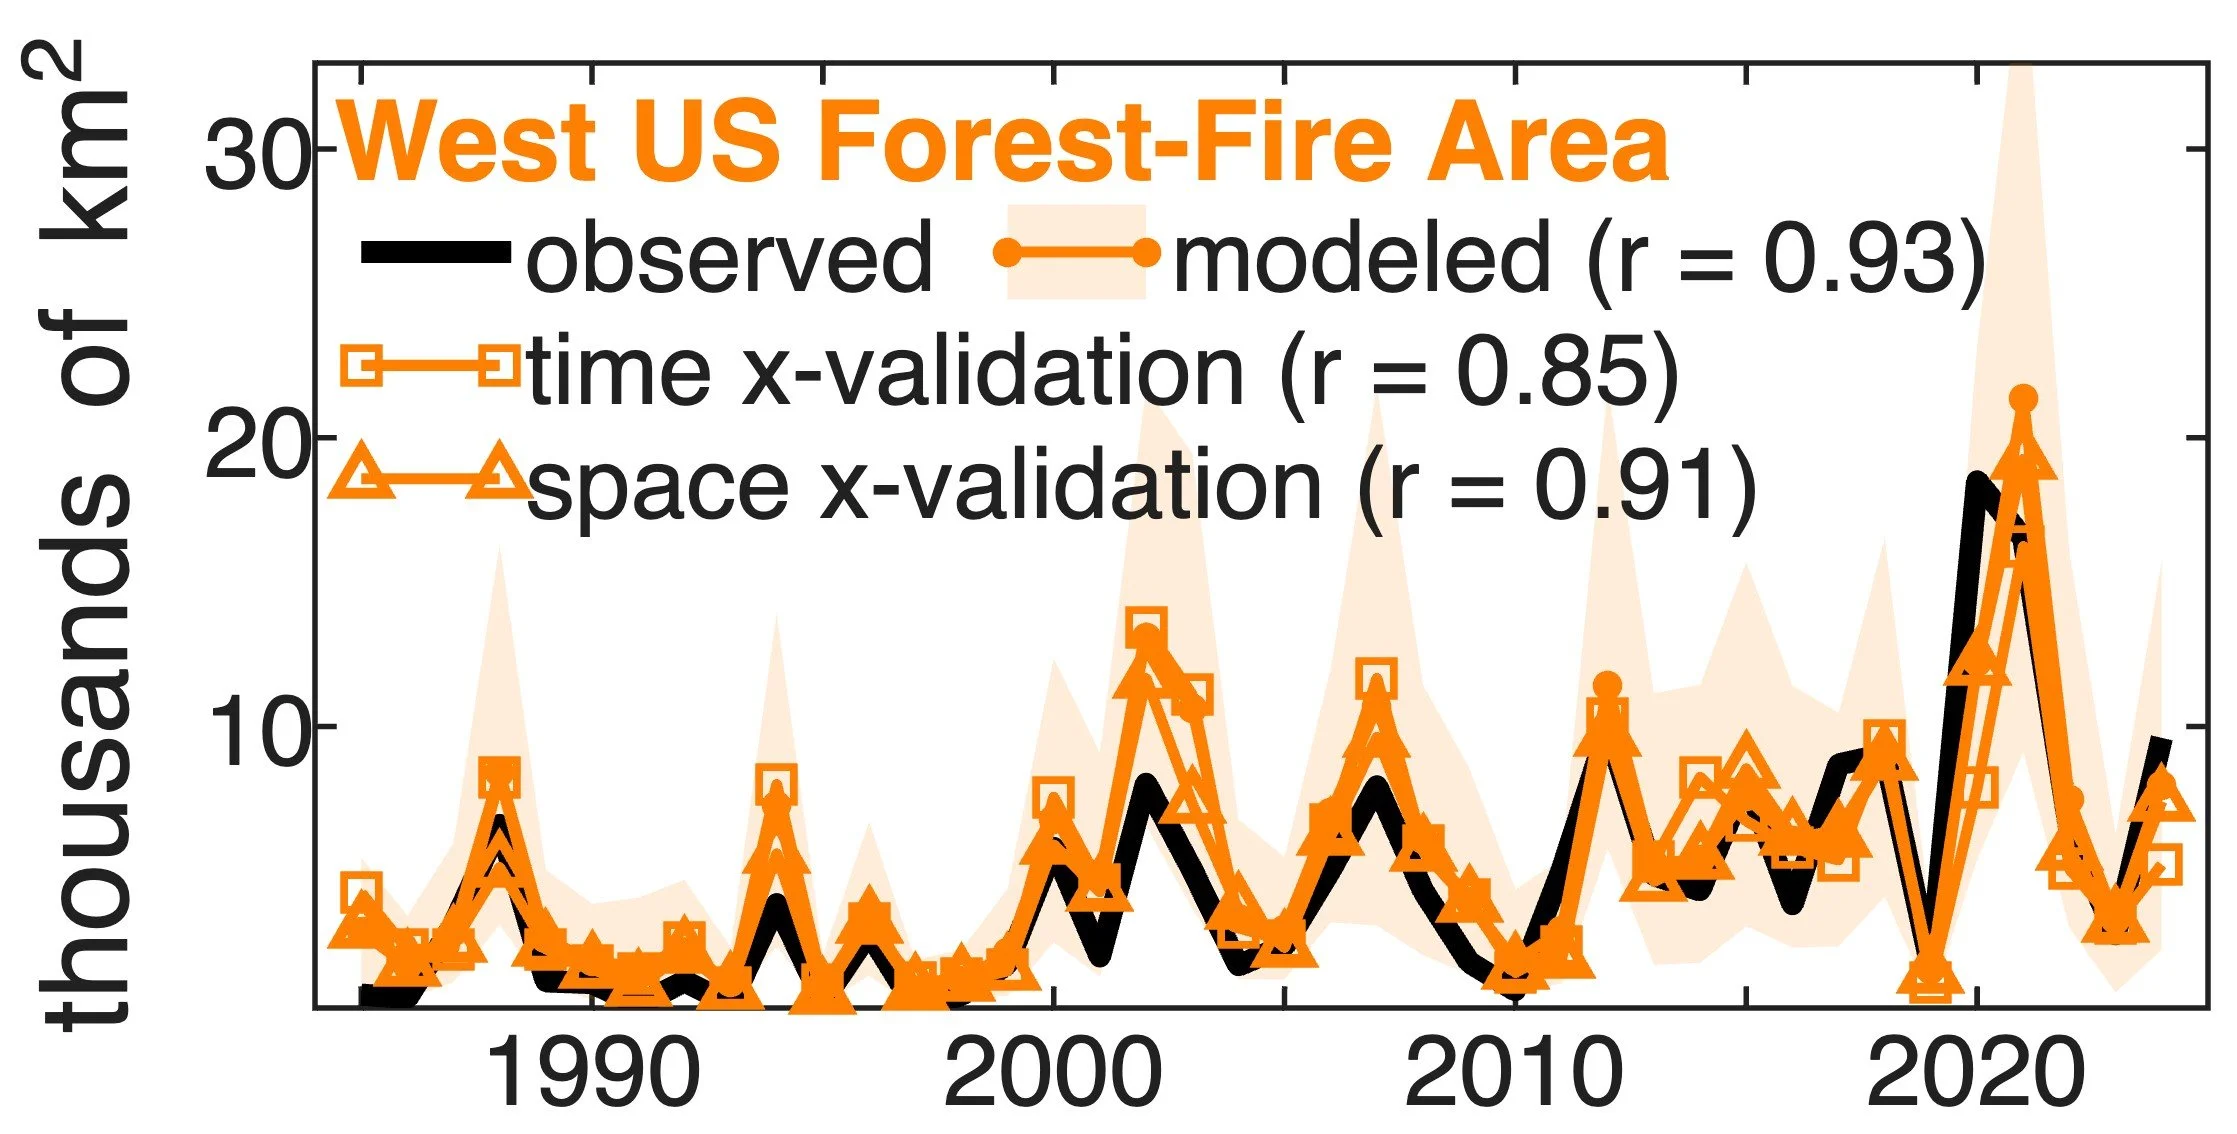
Time series of (black) observed and (orange) modeled annual forest area burned.
New database of western US wildfires covering 1984–2024
The new Western US MTBS-Interagency database of wildfires (WUMI2024a) includes the start dates, ignition locations, boundaries, and maps of area burned for >22,000 western US wildfires larger than 100 hectares (1 sq. km) from 1984–2024.
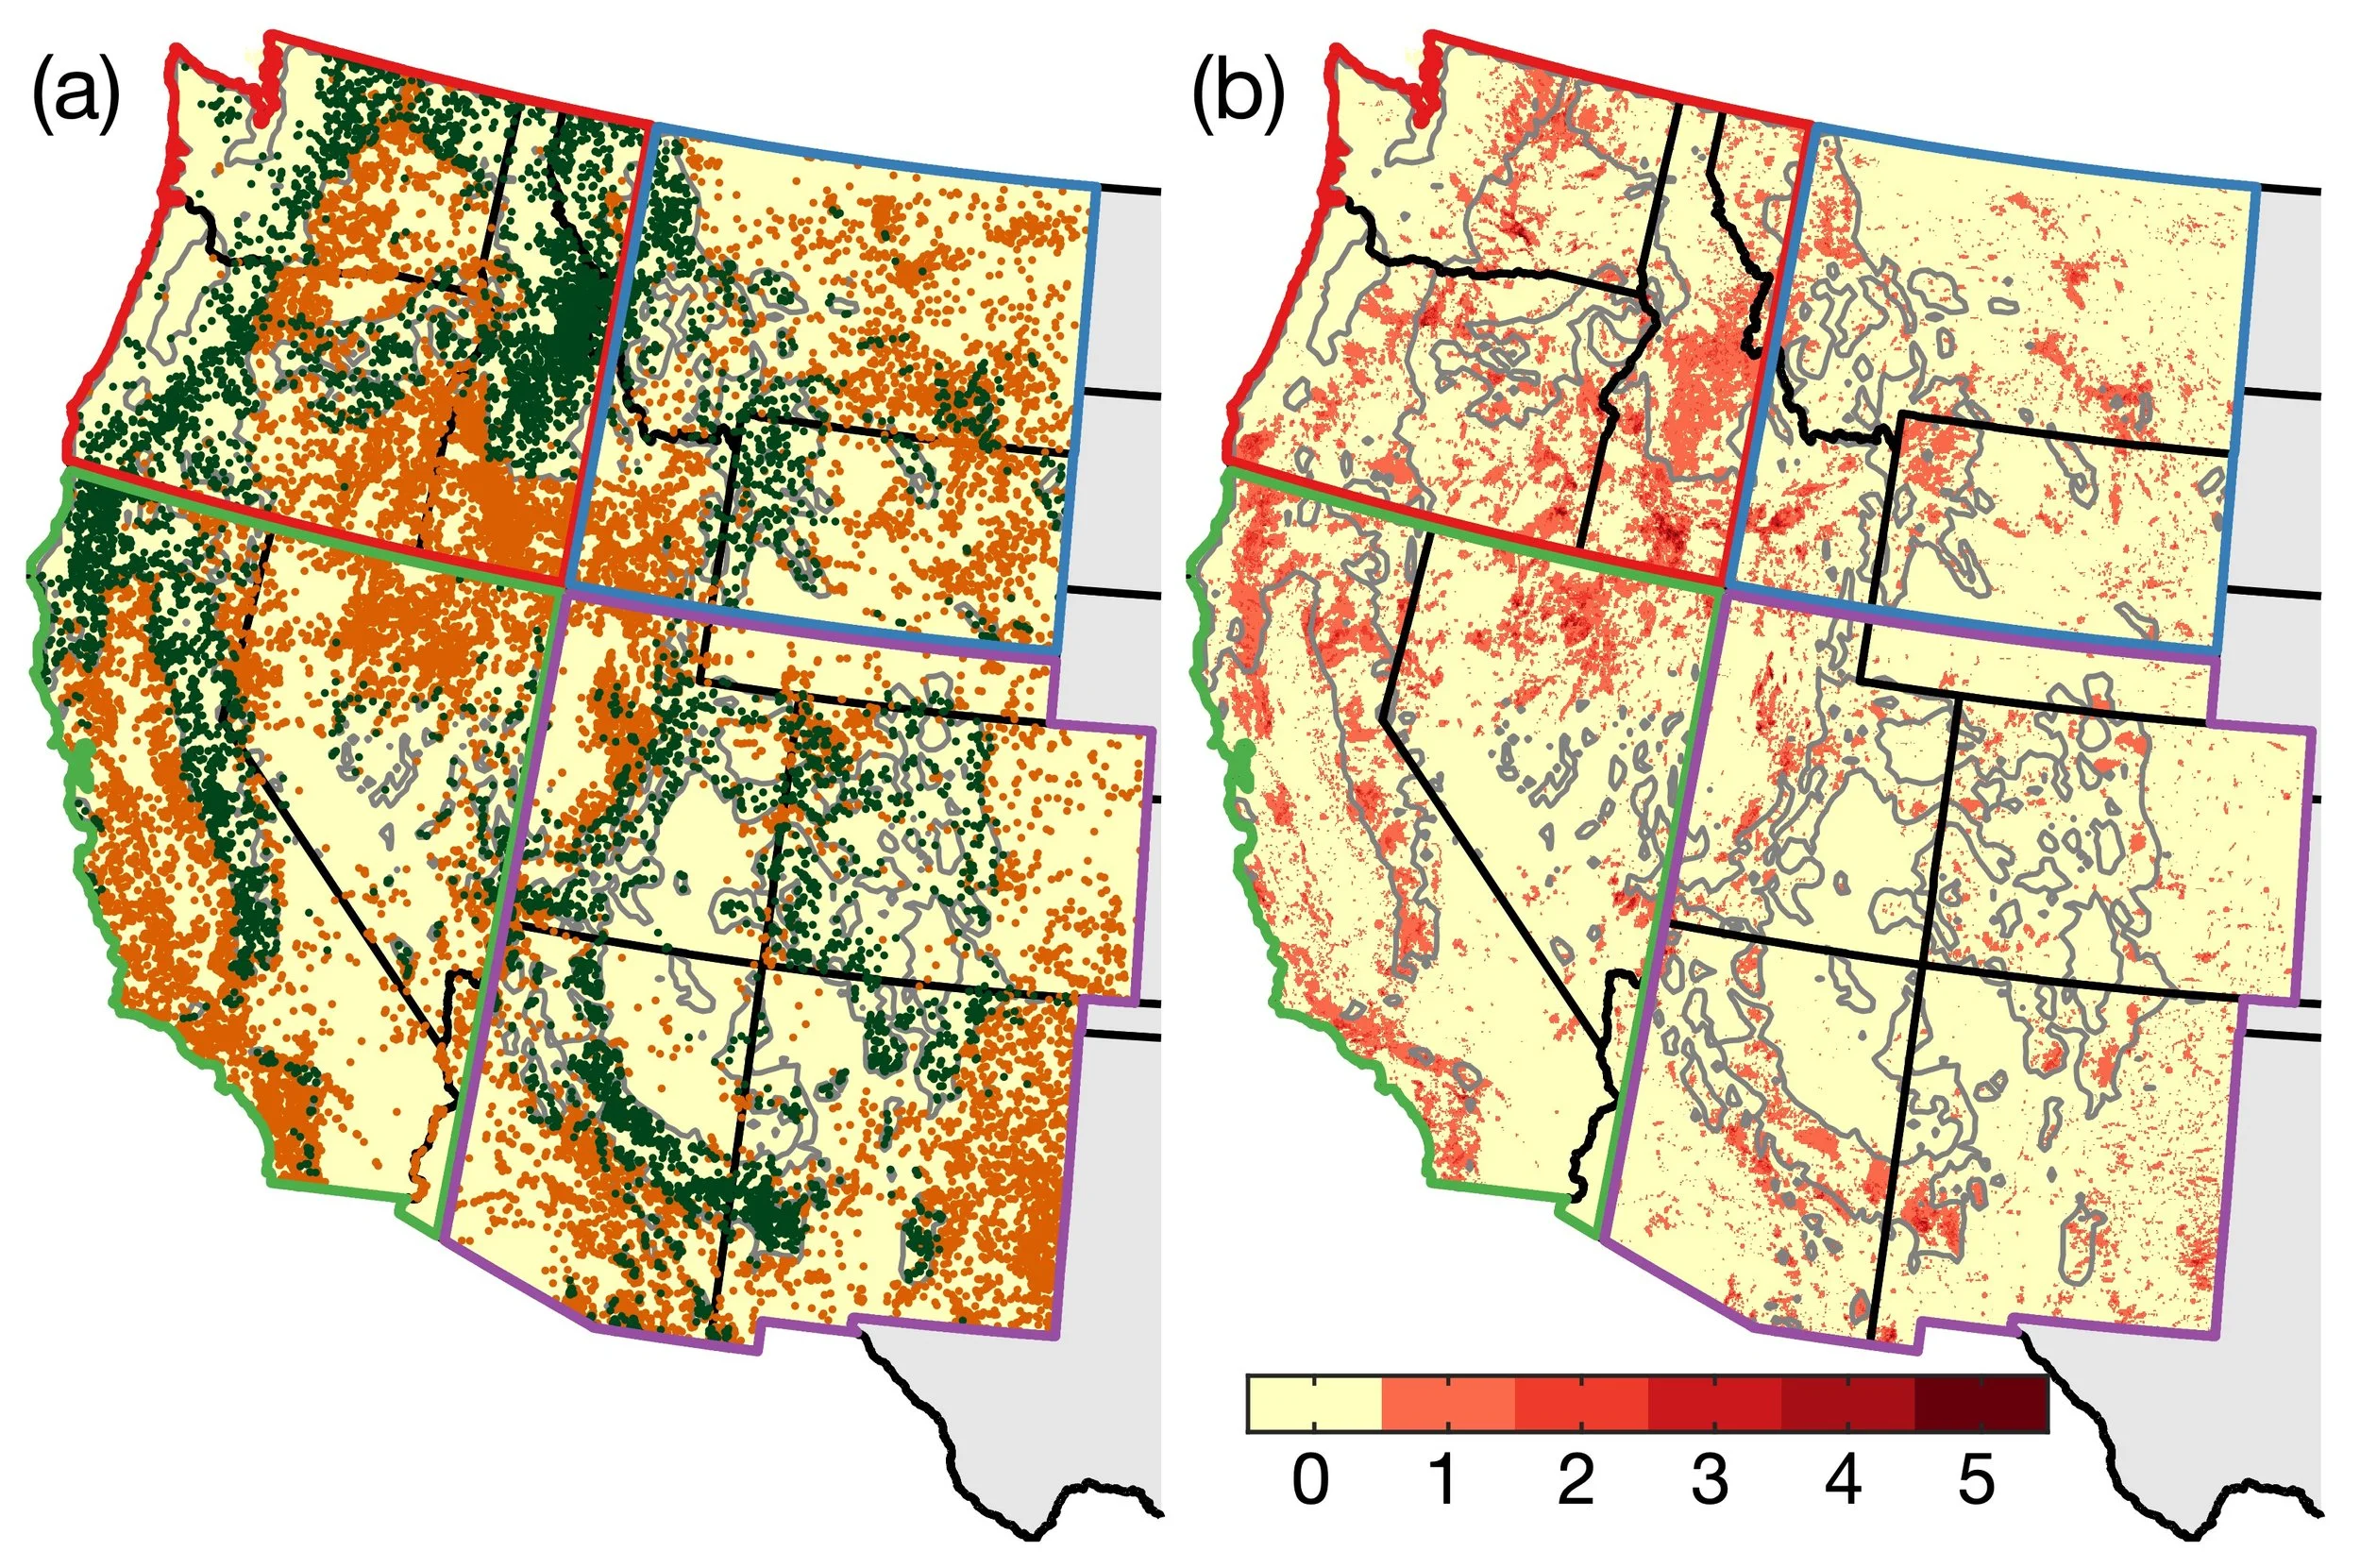
Maps of (left) fire ignition locations and (right) 1-km gridded counts of number of times burned.
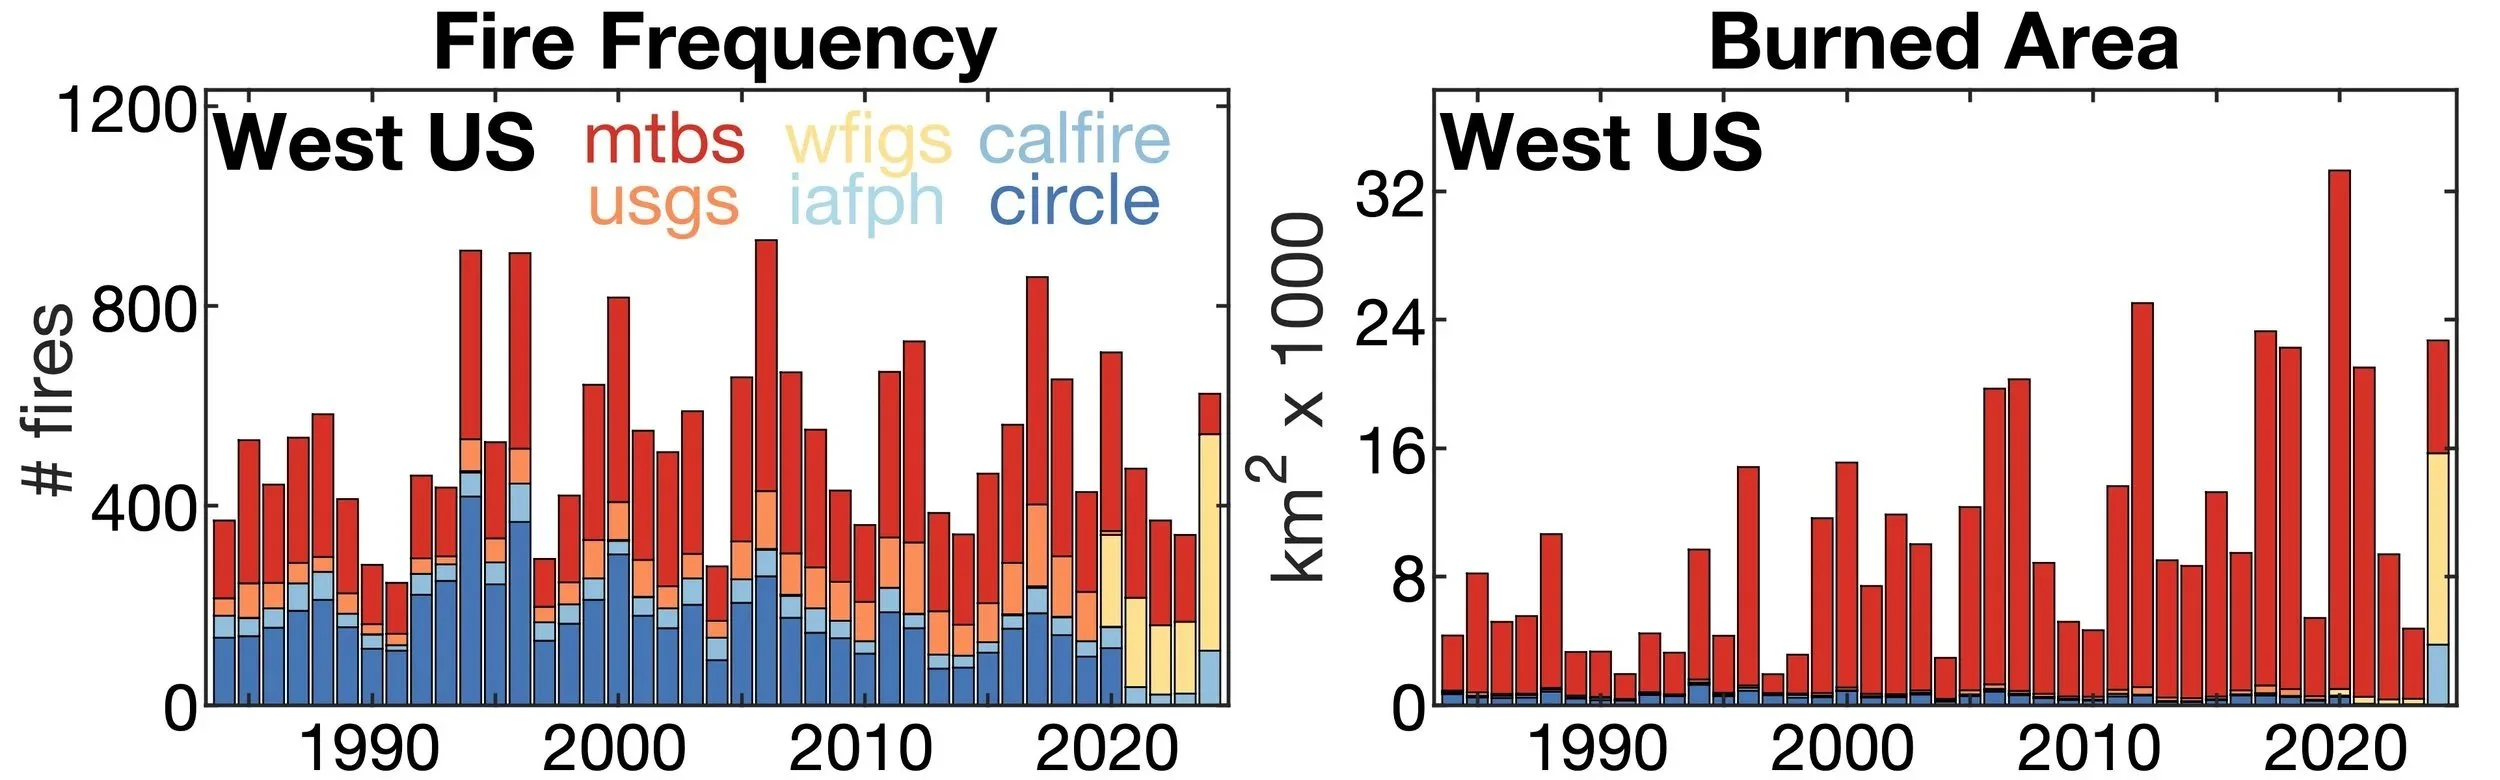
Time series of number of fires and area burned in the database.
Gavin Madakumbura wins UCLA’s 2025 Chancellor’s Award for Postdoctoral Research!

Three extreme climate events combined to drive the extreme January 2025 wildfire activity in coastal southern California
1) High fuel loads due to rapid plant growth after very wet conditions from winter 2023 through spring 2024
2) Very dry fuels caused mostly by failure of cool-season rains to arrive in fall-winter 2024/25 and amplified by anomalous warmth from summer–fall of 2024
3) Extraordinary Santa Ana wind event in January 2025

Figure by Gavin Madakumbura; see report for more details.
Qian He and Melissa Ferriter both awarded 2024 Future Investigators in NASA Earth and Space Science and Technology grants!
Qian’s research proposal was titled: “How do compound drought and heatwave events influence past and future vegetation and wildfire in a warming world?”
Melissa’s research proposal was titled: “Predicting Ecosystem Change: Wildfire-Driven Forest Conversion in Mixed-Conifer Forests of the Sierra Nevada”
Has global warming had a detectable influence on winter precipitation intensity in the western US?
When the globe warms, the atmosphere can accommodate more water in its vapor phase, so evaporation off the oceans should increase and, in most places, the strongest precipitation events should intensify. Could this have contributed to the exceptionally wet winter of 2023 in the western US? While it is true that essentially all climate events are impacted by human-caused climate change in one way or another, we do not find evidence for a systematic intensification of winter precipitation in the western US to date. In fact, precipitation intensity in northern California and much of the Pacific Northwest has declined since the early 1950s. The reason for the lack of intensification appears to be that the rate at which water vapor flows from the Pacific onto the continent during the strongest western US winter storms has not yet increased. These results are more or less in line with simulation results from climate models. Considering hundreds of simulations from 35 climate models, we found great variability in terms of when western US precipitation intensity is projected to be consistently enhanced, but on average this effect is not simulated to become detectable until the 2nd half of this century.

Park awarded a 2023 MacArthur Fellowship
“The MacArthur Fellowship is a five-year grant to individuals who show exceptional creativity in their work and the prospect for still more in the future. The Fellowship is designed to provide recipients with the flexibility to pursue their own artistic, intellectual, and professional activities in the absence of specific obligations or reporting requirements. There are no limits on age or area of activity. Individuals cannot apply for this award; they must be nominated.”
Bowen Wang awarded a 2024 UCLA Science Dean’s Prize for Undergraduate Research!
Bowen’s research project was to use a complex regional weather model coupled with a complex fire-spread model (WRF-Fire) to explore how southern California wildfires may be affected by the spread of invasive grass species.
Melissa Ferriter awarded a 2024 NSF Graduate Student Fellowship!
“The purpose of the NSF Graduate Research Fellowship Program (GRFP) is to help ensure the quality, vitality, and diversity of the scientific and engineering workforce of the United States. A goal of the program is to broaden participation of the full spectrum of diverse talents in STEM. The program recognizes and supports outstanding graduate students in NSF-supported science, technology, engineering, and mathematics disciplines who are pursuing research-based master’s and doctoral degrees at accredited United States institutions.”

Scatter plot of the annual area burned by wildfires in western US forests from 1984–2021 versus the annual vapor-pressure deficit, which is a measure of atmospheric aridity that is enhanced by high temperature and moderated by high humidity.
Causes of exponentially increasing burned area with rising aridity in the western United States
In this study, PhD student Caroline Juang, used records of >18,000 wildfires since 1984 to examine why the annual area burned in the western US, especially in forests, increases exponentially in response to warming and drying. She finds that much of this behavior can be raced to the way that individual fires spread: as fires growth, they tend to spread at exponential rates, so the larger a fire, the greater potential there is for further growth as long as fuel and meteorological conditions allow. This causes the distribution of individual fire sizes to be extremely skewed, with many small fires but occasional very large fires. As any process occurs that promotes larger fires, such as fuel drying, then the occasional very large fires have much more capacity for growth than the many small fires. Because year-to-year changes in annual burned area are driven largely by the area burned by the occasional very large fires, and because drying trends promote increasingly large leaps in the sizes of large fires, the year-to-year total area burned increases exponentially in response to drying.
Growing impact of wildfire on western United States water supply
How will increasing wildfire activity affect water resources in the water-limited western US? We used data from 179 streamflow gauges in the western US to find that, when more than approximately 20% of forest area burns in a watershed, streamflow is significantly enhanced by 20-30% for an average of 6 years after the fire. While forest fires have generally been too small historically to substantially affect water resources across large portions of the western US, rapidly growing annual forest-fire areas are now approaching the sizes that we expect to meaningfully affect mountain runoff at regional scales, such as the northern Sierra Nevada region. Climate models suggest that human-caused climate change will promote continued warming and drying trends in the western US, which, combined with the exponential response of forest-fire area to warming and drying, suggests continued rapid growth of forest-fire sizes. We do not expect that these trends will necessarily increase streamflow relative to the historical period, but instead that future streamflow will often be enhanced relative to the amount of precipitation that falls. In other words, if we do not begin to account for the effect of rapidly growing forest fires on mountain runoff, we are likely to be increasingly surprised by how much water is flowing out of the mountains. From a water-limited perspective, extra runoff may be considered good. However, extra water is often only good if it is expected. More work is needed to understand the complex dynamics of climate change, wildfires, vegetation, and hydrology in the western US and beyond.

Time series of 10-year running mean standardized water-year streamflow from the 29 study basins where >20% of forest area burned in a single year (dark red) compared to that expected from climate and the pre-fire relationships between streamflow and climate. Bar plot on right shows the average offset between observed and climate-predicted streamflow in 2000-2021 (dark red) versus the range of variability expected from chance alone (blue) as well as the same 2000-2021 offset calculated from basins that did not burn during the study period (green).
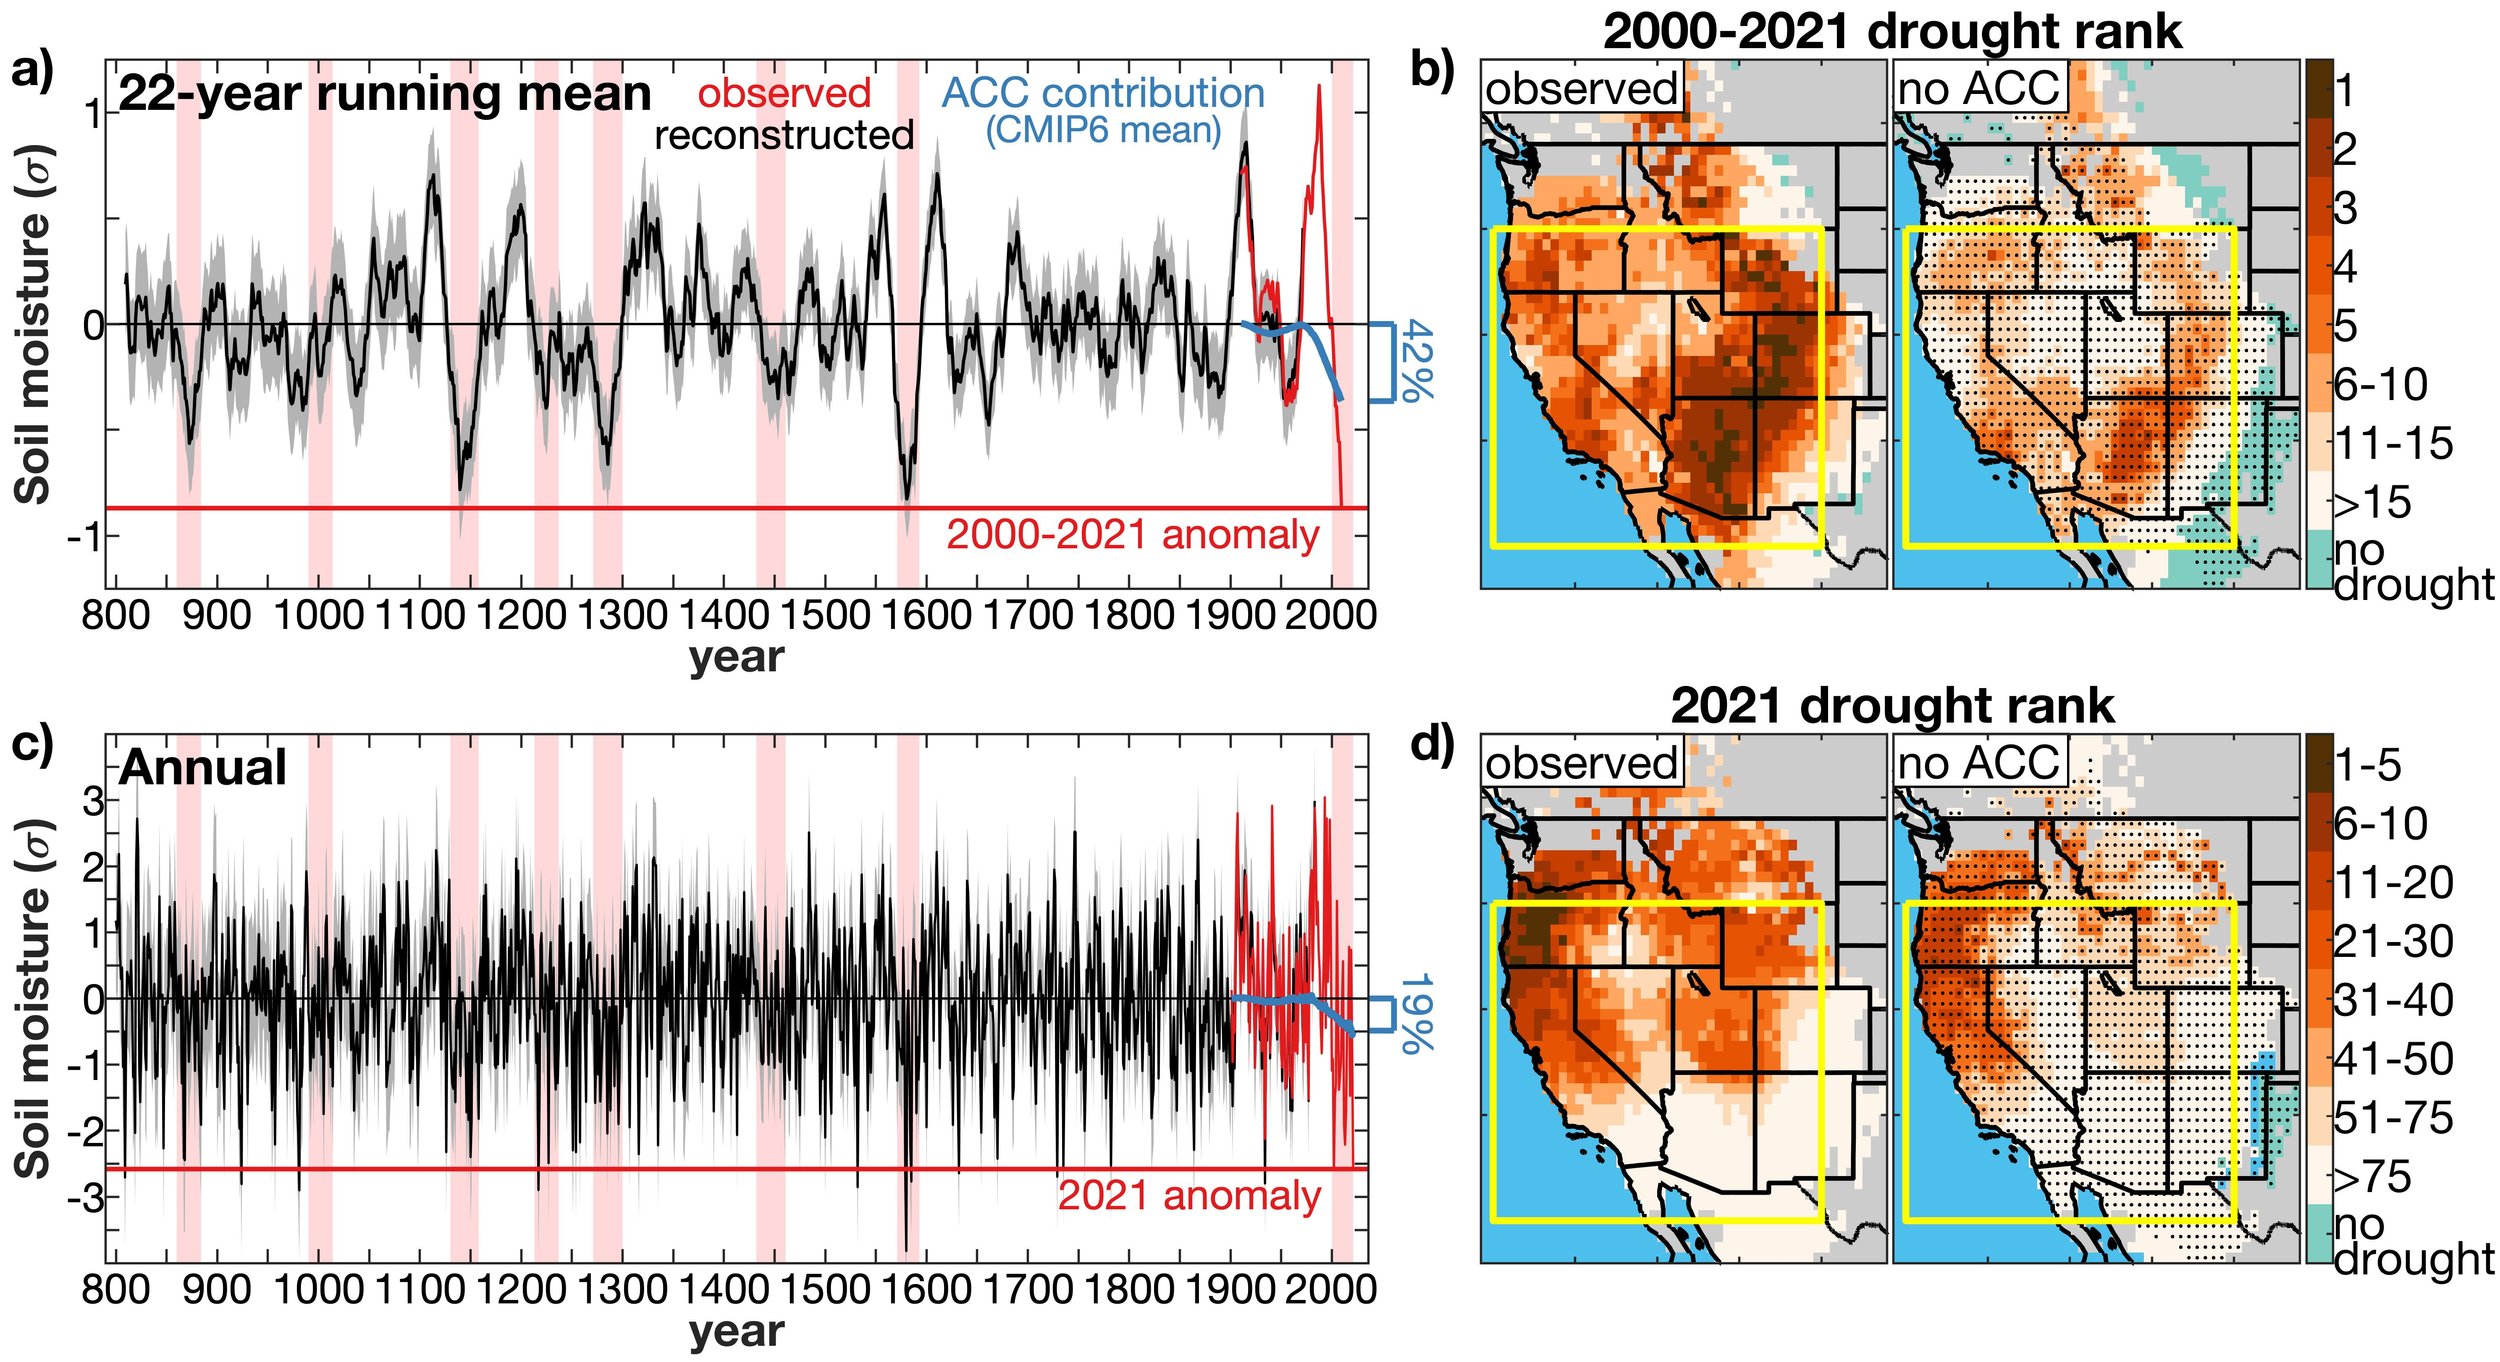
Tree-ring reconstruction of regionally averaged 0-200 cm summer soil moisture back to 800 AC. Top plots: 22-year running averages to enable comparison of the 22-yr drought from 2000-2021 to all other 22-year periods. Bottom plots: annual values. Contributions from anthropogenic climate change (ACC) were estimated by re-calculating the 1901-2021 soil-moisture balance with observed climate data after removing human-cased trends in precipitation, temperature, and humidity as represented by the average of ~30 climate models.
Rapid intensification of the emerging southwestern North American megadrought in 2020–2021
In 2020, we published a paper using tree rings to estimate that soil moisture during 2000-2018 in southwestern North America (yellow box in maps on left) had been lower than during nearly any other 19-year period in at least 1200 years, including the infamous megadroughts of the medieval period and late 1500s. After exceptional drought in 2020–2021, we revisited this study and found that the 22 years from 2000–2021 were likely the driest 22 consecutive years in at least 1200 years and that human-caused climate change was a substantial contributor to this drought’s severity. At the time of publication (Feb 2022) it was clear that this drought was headed into its 23rd year. The reconstructed megadrought events lasted 23–30 years, meaning that the ongoing Turn-of-the-21st-Century-Drought is a legitimate megadrought in terms of severity and duration.

Reconstruction of Sierra Nevada cool-season standardized precipitation index (SPI) and a wavelet analysis of the time series
Tree rings and observations suggest no stable cycles in Sierra Nevada cool-season precipitation
Most of California’s water resources originate in the Sierra Nevada as cool-season precipitation. It would help water managers if we had an idea as to whether the upcoming cool season(s) will be wet or dry. This type of seasonal forecasting is aided in some regions by teleconnections to sea-surface temperature patterns, but there is no clear relationship between ocean temperatures and Sierra Nevada precipitation. However, Sierra Nevada cool-season precipitation has exhibited some peculiar cyclic properties over the past century, with periodicities at 2.2 and 13-15 years. These cycles suggest that year-to-year swings in Sierra Nevada precipitation totals may not be totally random and that perhaps the cycles could be extrapolated forward in time to aid seasonal forecasting. We use tree rings to find that these cycles were not present prior to the 1900s. It would therefore be unwise to heavily rely on these cycles continuing into the future.
Large contribution from anthropogenic warming to an emerging North American megadrought
Western North America has seen near-persistent drought since the year 2000. We used climate observations, tree-ring records, land-surface modeling, and climate model simulations to find that human-caused warming put an otherwise moderate drought onto a megadrought trajectory in the first 2 decades of the 21st century. Tree rings tell us that natural climate variability will continue to cause wild swings in western North American water availability. Climate models project that over the long term, drying baseline conditions will make it increasingly easy to slide into severe drought and increasingly difficult to emerge from severe drought.

19-year running mean summer soil moisture in southwestern North America


Observed Impacts of anthropogenic climate change on wildfire in California
Annual burned area in California increased fivefold during 1972–2018, mainly due to summer forest fire. Anthropogenic warming very likely increased summer forest fire by drying fuels; this trend is likely to continue. Large fall fires are likely to become increasingly frequent with continued warming and possibly gradual declines in fall precipitation.
Mid-latitude freshwater availability reduced by projected vegetation responses to climate change
Climate models project changes in vegetation to have major impacts on soil moisture and river flow. We need to improve how we model vegetation in order to improve projections of drought and water supply.

Increased fall precipitation in the southeastern United States driven by higher‐intensity, frontal precipitation
Fall precipitation in the southeast US has increased by ~40% over the past century. This is due to increases in the intensity, not frequency, of precipitation events, most of which are frontal and not tropical cyclones. The cause of the increase is mostly intensified wind from the Gulf of Mexico.
